
Umar Hussaini
Data Analyst | BI Developer
About me
Dedicated IT Support and Helpdesk professional with experience providing technical support, troubleshooting
hardware and software issues, managing service requests, and supporting enterprise ICT operations. Skilled in
Microsoft Windows, Microsoft Office 365, Salesforce CRM, networking fundamentals, system administration,
and end-user support. Experienced in delivering timely incident resolution, maintaining IT infrastructure,
supporting public health projects, and ensuring business continuity. Recognized for strong problem-solving
abilities, excellent customer service, and the ability to work effectively in fast-paced, multidisciplinary
environments.
Skills

Excel | Power BI | Tableau | SQL | Python
Data Cleaning - 3+ Years
Data Visualisation - 2+ Years
Team Collaboration - 3+ Years
Report Documentation - 3+ Years
Featured Projects
Power BI
Information Management System
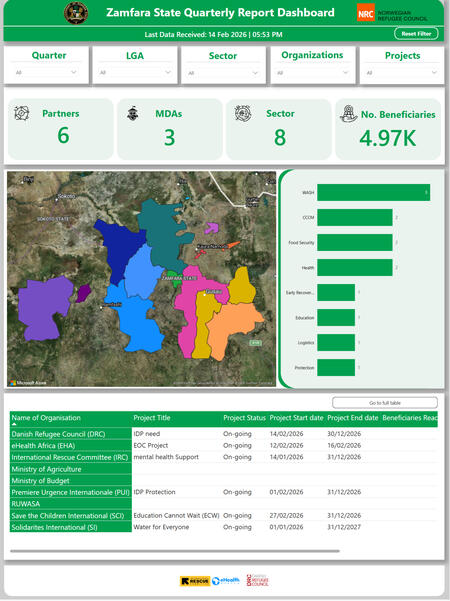
The Zamfara State Information Management System Dashboard is an interactive digital platform developed to monitor, analyze, and visualize key state activities, enabling data-driven decision-making for government agencies and stakeholders.
Power BI
Command Center Report
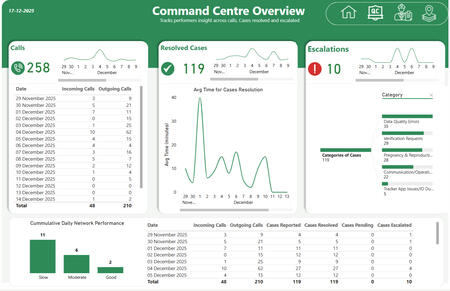
The Command Center Operations Dashboard is an interactive tool used to monitor and analyze command center activities. It provides insights into key performance indicators such as total calls received, resolved cases, escalated cases, and average resolution time
SQL Project
Olympics History
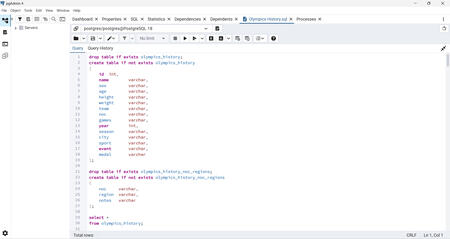
Olympics History SQL Analysis is a project that I used SQL to explore historical Olympic data, analyzing athlete participation, medal distribution, and country performance across different Olympic Games.
Professional Certifications
Google Data Analytics
Google IT Support
Education
B.tech Industrial Mathematics - Federal University of Technology Minna (FUTMinna)
Current: Masters in Information Communication and Technology - Bayero University Kano (BUK)
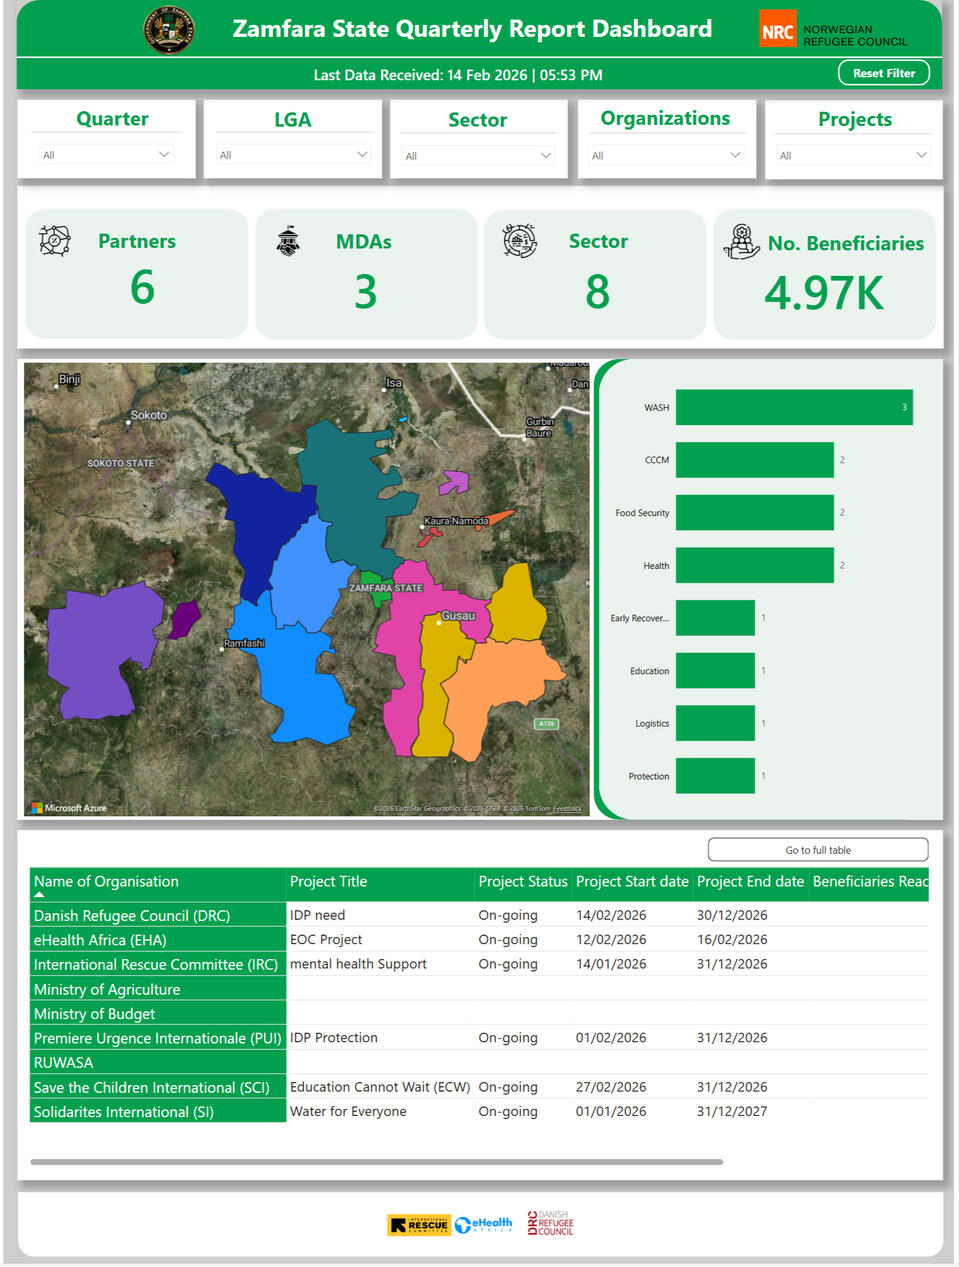
Zamfara State | IMS
The Zamfara State Information Management System Dashboard is a data visualization platform designed to provide insights into activities and operations across the state. It enables stakeholders to monitor planned activities, track performance, and support informed decision-making.Data Collection: Data is collected using the KoboCollect platform. Ministries, Departments, and Agencies (MDAs), as well as partners, fill out digital forms whenever they plan activities. This ensures that activity data is captured in a centralized and structured manner.Data Cleaning and Preparation: After collection, the data is exported and cleaned using Microsoft Excel. During this stage, errors are corrected, duplicates are removed, and the dataset is organized to ensure accuracy and consistency before analysis.Data Visualization: The cleaned dataset is then imported into Microsoft Power BI, where interactive dashboards are created. These dashboards present key indicators and activity insights using charts, graphs, and KPI cards, allowing users to easily monitor state activities and trends.Through these processes, the dashboard provides a centralized platform for monitoring activities and improving operational efficiency across Zamfara State.